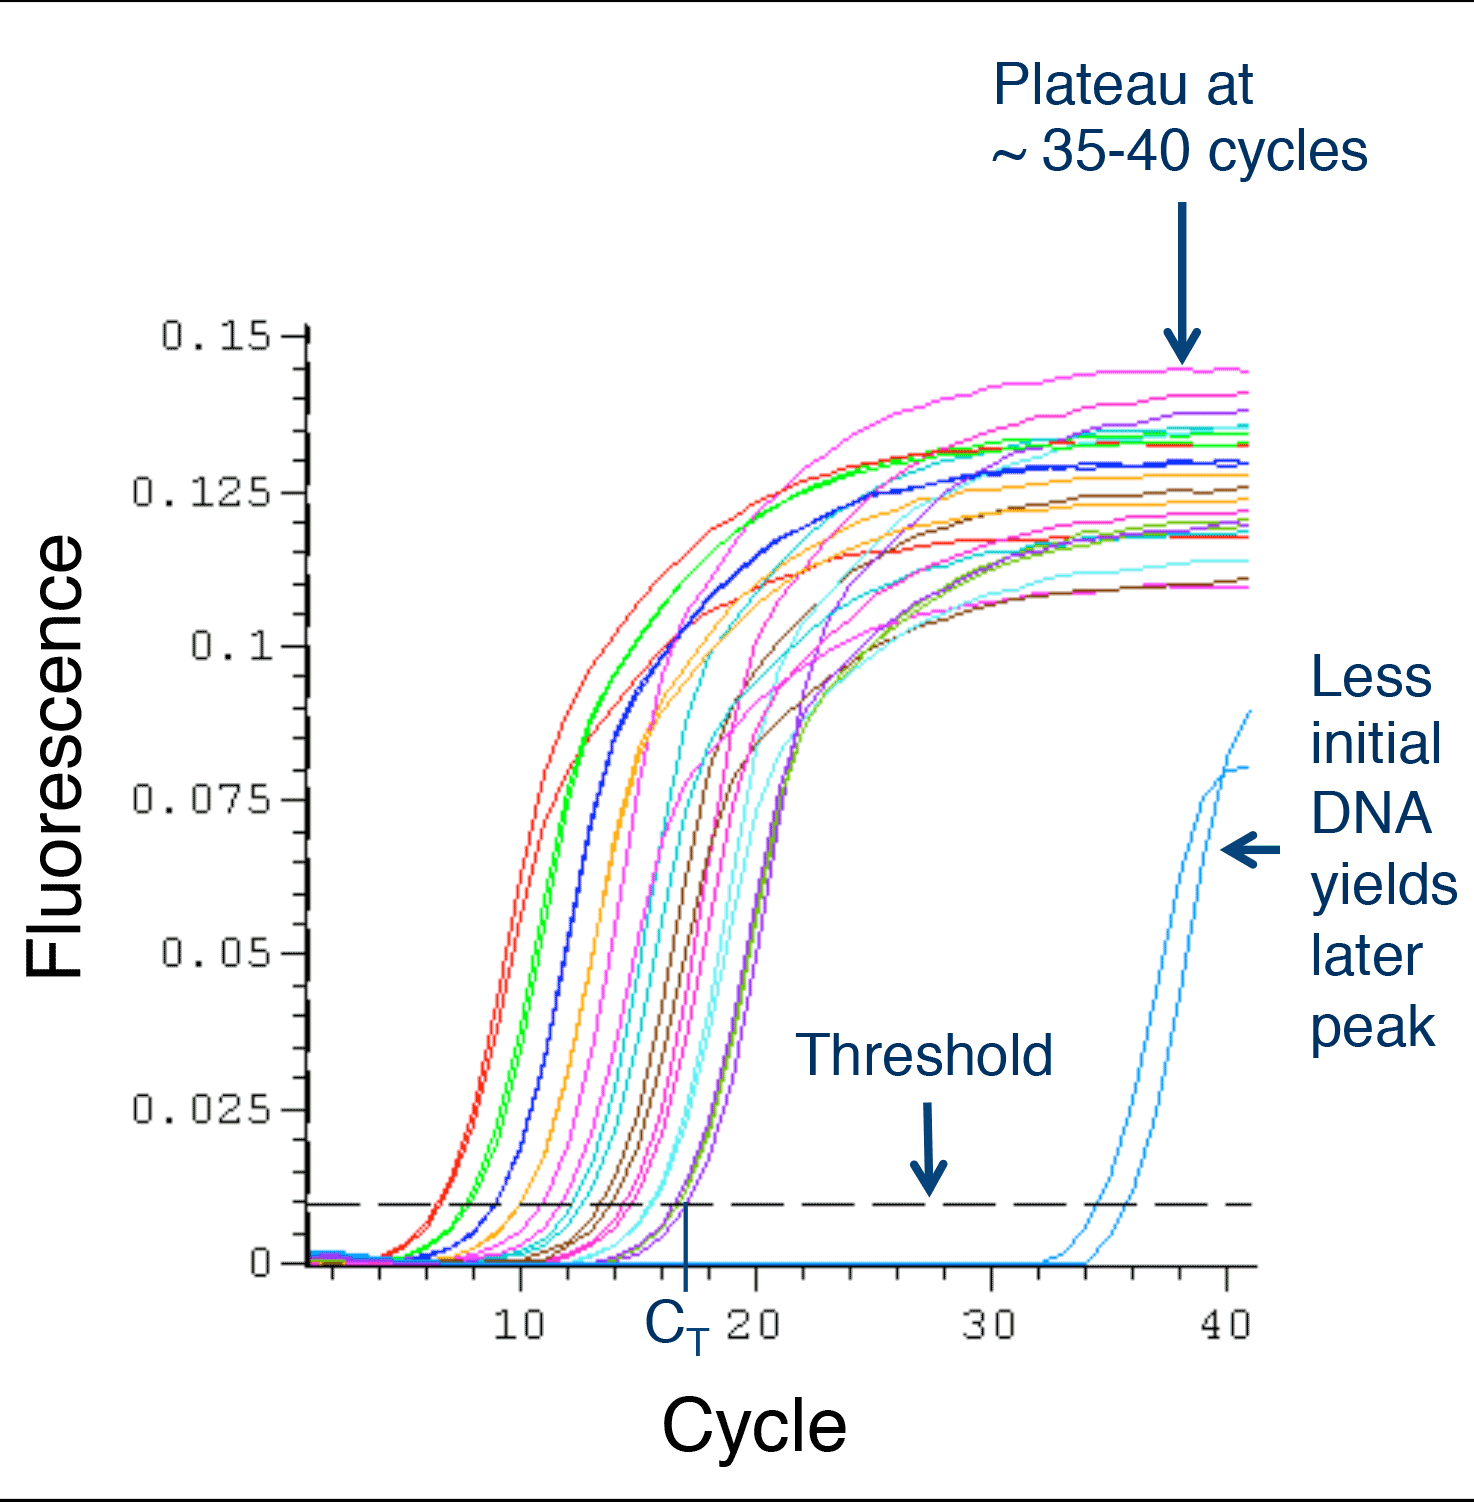
Amplification of DNA in real time. CT marks the threshold cycle number for the purple curve. (Adapted from Reardon, 2004)
Monitor DNA Amplification in Real-Time
After each cycle, the graph is updated so that amplification can be seen in real-time.
- A plateau is reached when reactants run out (~35 to 40 cycles in the figure).
- Two curves (in light blue) start to form after 30 cycles due to fewer starting copies of DNA.
- CT is the threshold cycle; the cycle number when the sample fluorescence crosses the threshold value.